
Automated Reporting Explained for SMB Decision-Makers
Published: August 9, 2026 · 9–10 min read
TL;DR:
- Automated reporting creates, analyzes, and delivers business reports without manual input, saving significant time.
- It connects to data sources, processes data automatically, and provides scheduled summaries with minimal errors.
Automated reporting is defined as the automatic creation, analysis, and delivery of business reports without manual steps. For small and medium business owners, this means your sales summaries, cash flow snapshots, and collections updates arrive on schedule without anyone pulling data by hand. Automated systems reduce report generation time by 70–80%, which translates to over 180 hours saved per person annually. That is time your team can spend reviewing results and acting on them, not assembling spreadsheets. Understanding what is automated reporting explained in practical terms is the first step toward running a leaner, faster operation.

What is automated reporting and how does it work?
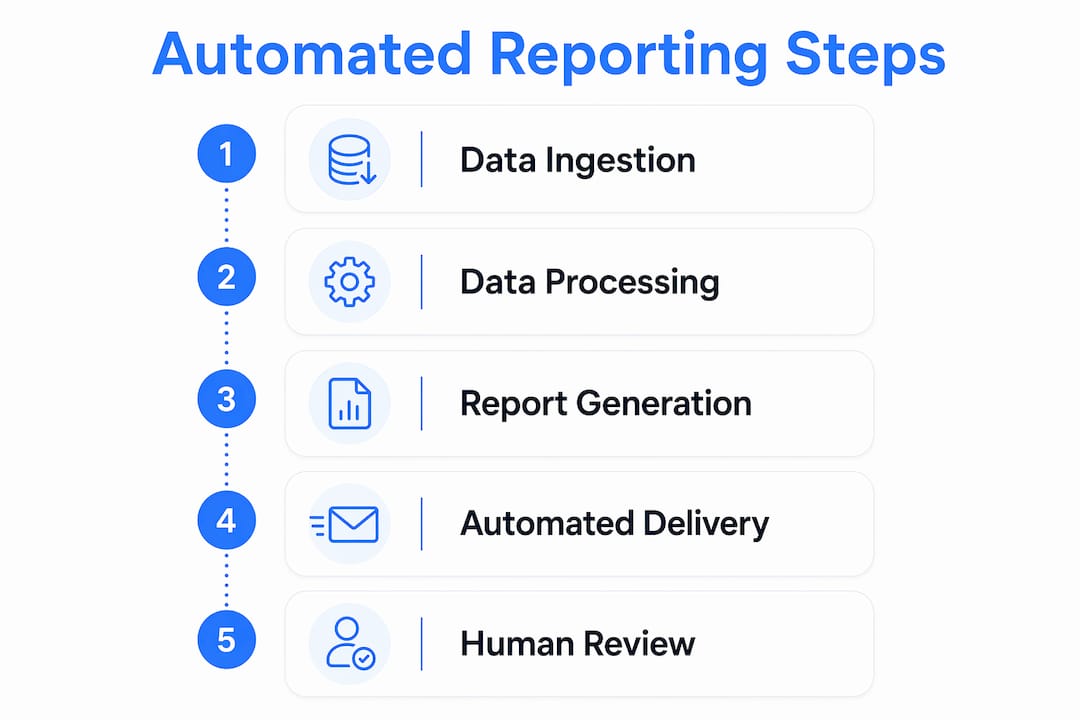
Automated reporting is the industry term for systems that connect to your data sources, process that data on a schedule, and deliver formatted reports to the right people without human involvement at each step. The process runs in four stages: data ingestion, automated analysis, narrative generation, and scheduled delivery. Each stage hands off to the next without you touching a keyboard.
Data ingestion pulls figures from your accounting software, CRM, or collections platform at a set time. Automated analysis applies pre-defined calculations and flags anomalies. Narrative generation converts those numbers into plain-language summaries. Scheduled delivery sends the finished report by email, Slack, or PDF on the exact cadence you set.
The difference between traditional report automation and AI-driven automated report generation is significant. Traditional automation schedules an export and formats it. AI-driven systems interpret the data and write context around it. Advanced AI reporting pipelines deliver stakeholder-ready reports in 15–30 seconds, including narrative summaries that explain what changed and why.
Pro Tip: Start with one report type, such as a daily collections summary, before expanding. A single well-built automated report teaches you more about your data quality than a dozen manual ones.
Most automated reporting systems sit on three layers. The first layer handles data connectors, pulling from APIs or database exports. The second layer runs the analysis logic, either through coded scripts or a business intelligence platform. The third layer formats and delivers the output. Understanding this structure helps you diagnose problems when a report looks wrong.
What are the key benefits and limitations of automated reporting for SMBs?
The core benefits of automated reporting fall into five categories: time savings, consistency, error reduction, repeatability, and the ability to scale without adding staff. Each one matters differently depending on where your business feels the most friction.
- Time savings: Reducing reporting time by 70–80% frees your team from repetitive data work every week.
- Consistency: Every report uses the same calculations and the same format, so comparisons across weeks and months are reliable.
- Error reduction: Removing manual copy-paste steps eliminates the most common source of reporting mistakes.
- Repeatability: Once built, the system runs the same process every time without variation.
- Scalability: You can add new report types or new recipients without proportional increases in labor.
The advantages of automated reporting are real, but so are the limitations. The most common pitfall is automating a broken process. If your source data contains errors, the automated system distributes those errors faster and more consistently than any human would. Unreliable inputs only speed the distribution of questionable numbers. That outcome is worse than no automation at all.
| Dimension | Manual reporting | Traditional automation | AI-enhanced reporting |
|---|---|---|---|
| Speed | Hours per report | Minutes per report | 15–30 seconds per report |
| Consistency | Variable | High | High |
| Narrative context | Human-written | None | AI-generated |
| Error risk | High (manual steps) | Medium (formatting errors) | Low (with validation) |
| Data quality checks | Ad hoc | Limited | Built-in validation rules |
The role shift that comes with automation is worth naming directly. Your team moves from data entry to strategic review. Automated reporting shifts analysts toward anomaly investigation and assumption testing rather than manual assembly. For a small business owner, that means you spend your Monday morning asking "why did collections slow down?" instead of "where is the report?"
Pro Tip: Run your first automated reports in parallel with your existing manual process for two to four weeks. This lets you catch discrepancies before you rely on the automated version for decisions.
How is automated reporting different from dashboards and other data tools?
Dashboards and automated reports solve different problems. Confusing them leads to buying the wrong tool or building the wrong system.
Dashboards serve exploratory, ad-hoc analysis. You log in, filter by date range, drill into a region, and look for patterns. They are interactive and real-time. Automated reports deliver scheduled, standardized summaries. They arrive in your inbox whether you log in or not. The distinction matters because dashboards and automated reports complement each other rather than compete.
Use a dashboard when you need to investigate something specific. Use an automated report when you need a consistent weekly or daily update that does not require you to remember to check a platform. A collections manager, for example, might use a dashboard to investigate why one customer segment is paying late, and an automated report to confirm that total overdue balances moved in the right direction this week.
Automated reporting also differs from simple scheduled exports. A scheduled export sends a raw data file. Properly designed automated reporting systems standardize calculations, apply validation rules, and create audit trails. That structure is what makes a report trustworthy enough to act on. For more context on how this applies in financial operations, real-time reporting in finance covers the distinction between live dashboards and scheduled report delivery in detail.
Automated reporting does not replace human analysis. It removes the mechanical work so that human judgment focuses on interpretation and decisions.
How to implement automated reporting effectively in your SMB
A practical implementation follows six steps. Skipping any of them increases the risk that your automated reports become a source of confusion rather than clarity.
-
Audit your existing reports. List every report your team produces, how often it runs, who receives it, and what decisions it drives. Identify which ones are highly structured and run frequently. The fastest return on investment comes from automating daily or weekly operational reports that are already highly structured.
-
Select your tools. Choose a system that connects to your existing data sources. Entry-level platforms handle basic scheduling and formatting. Enterprise platforms add AI narrative generation, validation rules, and audit trails. Match the tool to your current data maturity, not your aspirational one.
-
Connect your data pipelines. Build or configure the connections between your source systems and the reporting tool. Test each connection with a sample pull before building any report logic on top of it.
-
Define your report templates. Specify exactly which metrics appear, how they are calculated, and what format the output takes. Separating hard-coded calculations from AI-generated narrative prevents numeric errors and reduces the risk of AI-written summaries misrepresenting the data.
-
Schedule and deliver. Set the cadence, recipients, and delivery format. Daily sales reports, weekly marketing summaries, and monthly collections overviews each serve different decision cycles.
-
Monitor with human review. Route initial automated report drafts for human review for approximately four weeks before distributing them without oversight. This builds organizational trust and catches errors before they affect decisions.
Pro Tip: Build automated validation checks into your data pipeline, not just your report template. A check that flags missing data before the report runs saves far more time than one that catches errors after distribution.
The most common mistake at this stage is skipping data validation. Automated validation tests are essential because manual checks cannot scale with recurring automated pipelines. A report that runs every day needs a check that runs every day too.
Key Takeaways
Automated reporting delivers consistent, timely business summaries without manual effort, and its value depends entirely on the quality of the data and processes behind it.
| Point | Details |
|---|---|
| Core definition | Automated reporting connects data sources, applies analysis, and delivers formatted reports on a schedule without manual steps. |
| Time savings are real | Systems reduce report generation time by 70–80%, freeing over 180 hours per person annually for higher-value work. |
| Data quality comes first | Automating bad data distributes errors faster; validate upstream sources before building any automated pipeline. |
| Dashboards are not the same | Dashboards support ad-hoc exploration; automated reports deliver scheduled summaries for routine decisions. |
| Human review builds trust | Run automated reports alongside manual checks for four weeks before removing human oversight from the process. |
Why I think most SMBs automate the wrong thing first
Most business owners I talk to want to automate their most complex report first. It is the one that takes the longest to build manually, so it feels like the biggest win. That instinct is wrong, and it costs time.
The reports that deliver the fastest value from automation are the ones you already produce consistently and correctly. Daily sales totals. Weekly overdue balances. Monthly collections summaries. These are already structured. The calculations are agreed upon. The recipients are known. Automating them takes days, not months, and the results are immediately trustworthy.
The complex reports, the ones with multiple data sources, conditional logic, and narrative interpretation, require your data infrastructure to be solid first. If you automate those before your pipelines are clean and validated, you will spend more time debugging the automated version than you ever spent building it manually.
The real shift that automation creates is not speed. It is accountability. When a report runs the same way every time, discrepancies become visible. A number that was always slightly off in the manual version now stands out because the automated version is consistent. That visibility is where the actual business value lives.
Think of automated reporting as process control, not just time-saving. The goal is a system you trust enough to act on without second-guessing the source.
— Tyler
How Interval-ai supports automated reporting for SMB decision-makers
Interval-ai applies the same principles of automated data analysis and consistent delivery to one of the most time-sensitive reporting needs for SMBs: collections. The platform connects to your payment data, analyzes customer behavior patterns, and manages outreach across multiple channels without requiring additional staff. Interval-ai clients report reducing days to payment by over 30 days and recovering significant revenue without expanding their teams. If your business is ready to put automated reporting to work where cash flow is at stake, visit Interval-ai to see how the platform fits your current workflow.
FAQ
What is automated reporting in simple terms?
Automated reporting is the process of generating and delivering business reports on a schedule without manual data collection or formatting. The system pulls data, applies calculations, and sends the finished report automatically.
How much time does automated reporting actually save?
Automated reporting reduces report generation time by 70–80%, saving over 180 hours per person annually for teams producing daily reports. That figure assumes roughly 45 minutes of manual work eliminated per report cycle.
Is automated reporting the same as a dashboard?
No. Dashboards are interactive tools for ad-hoc exploration of data. Automated reports are scheduled, standardized summaries delivered on a set cadence, often by email or PDF, without requiring the recipient to log into any platform.
How do I know if my data is ready for automated reporting?
Your data is ready when your key metrics have agreed-upon definitions, your source systems are consistent, and you can produce the same report manually with the same result twice in a row. If manual reports vary unexpectedly, fix the data quality issues before automating.
How long does it take to implement automated reporting for an SMB?
A single, well-structured daily or weekly report can be automated in a matter of days using existing tools. A full implementation across multiple report types, with validation rules and human review cycles, typically takes four to eight weeks to reach reliable, unsupervised delivery.
